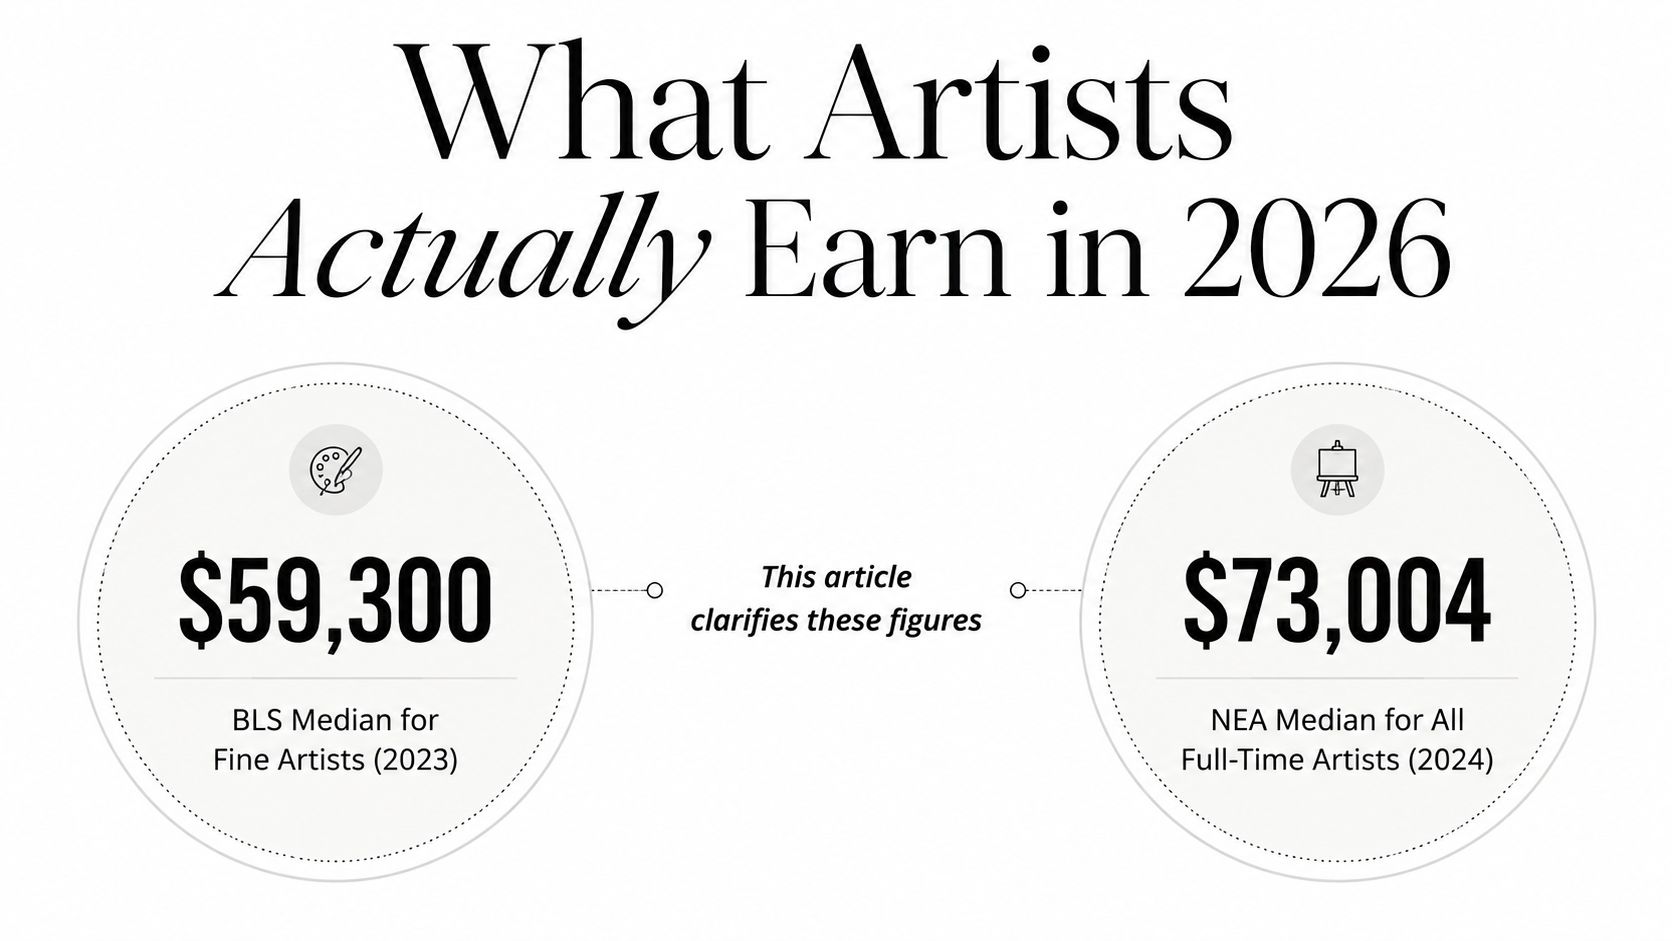
The average salary for artists is not one number. In the U.S., fine artists had a $59,300 median annual wage in May 2023, while full-time employed artists reached $73,004 in 2024, so the answer depends on the exact role and work model.
Table of Contents
- What Artists Earn in 2026
- Salary Ranges by Artist Specialty
- Factors That Move Artist Pay Up or Down
- Where the Numbers Come From and How to Use Them
- Why Some Artist Roles Pay Far More Than Others
- Strategies to Increase Your Earnings as an Artist
- Choosing Your Path and Setting a Realistic Target
- Common Questions About Artist Pay
What Artists Earn in 2026
The clearest pay anchors are the BLS median of $59,300 for fine artists in May 2023 and the NEA median of $73,004 for full-time employed artists in 2024. Those figures point to the same market reality, artist income is spread across a wide band rather than clustering around one reliable number. The official wage tables from BLS wage data for fine artists and NEA's 2024 artist earnings report are useful because they expose that unevenness instead of smoothing it away.
Why a single average misses the point
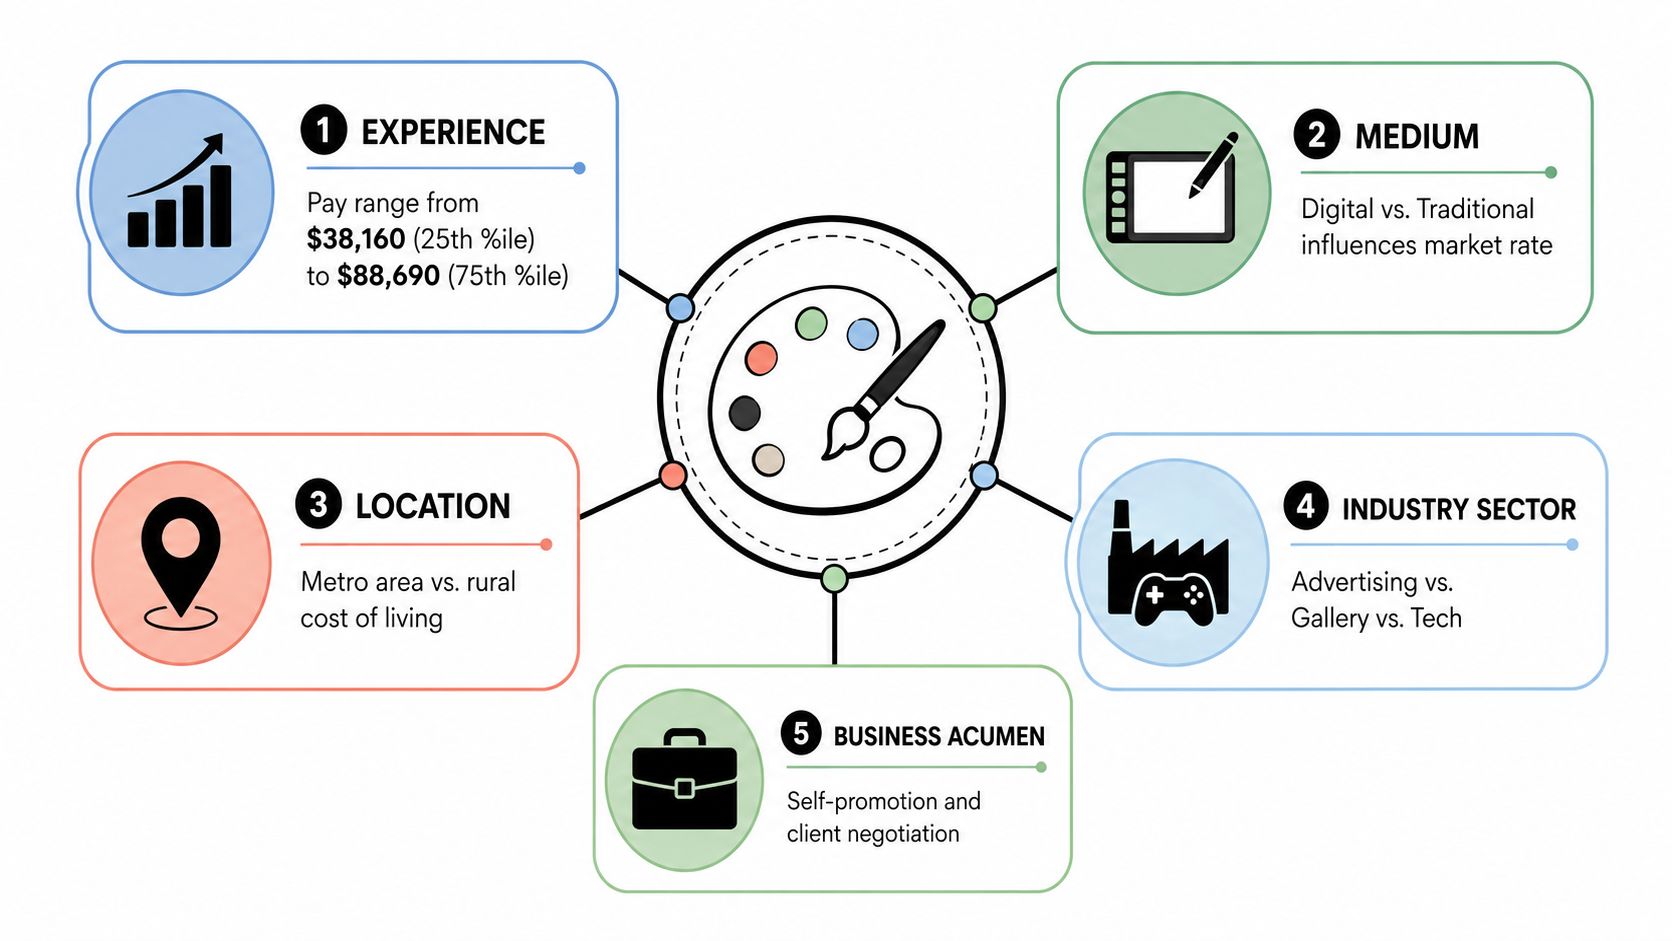
A headline average hides the labor market beneath it. BLS wage data for fine artists shows a range from $28,390 at the 10th percentile to $135,420 at the 90th percentile. Two artists can sit under the same occupation label and still live in completely different pay worlds. The same distribution puts the 25th percentile at $38,160 and the 75th percentile at $88,690, so the middle half of the occupation still spans a very wide band. BLS craft and fine artists outlook
That spread matters because “artist” covers several labor markets at once. A gallery painter, a staff illustrator, a studio designer, and a live performer do not sell the same thing, bill the same way, or face the same hiring rules.
The main artist types this guide separates
The most useful way to read artist pay is by specialty, not by the umbrella label. Fine artists and illustrators sit at one end of the range, while design-heavy roles and adjacent creative technical jobs tend to support steadier full-time earnings. Musicians often face a different income structure altogether, and audio engineering is closer to a technical services model than to gallery-based art. A graphic comparing US Bureau of Labor Statistics and National Endowment for the Arts artist salary data.
Practical rule: if a salary guide does not define the exact artist role, the number is too vague to use in negotiation or planning.
The rest of the analysis focuses on what each specialty earns, what pushes pay upward, and how to turn public wage data into a realistic target for your own career.
Salary Ranges by Artist Specialty
A single “average salary for artists” figure hides a wide spread. Fine artists cluster around the middle of the range, while adjacent creative roles such as animation, sound, and production sit higher because they are tied to different budgets, hiring systems, and revenue models.
| Artist Specialty | Median / Typical | Entry-Level Floor | Top Earners |
|---|---|---|---|
| Fine artists | $59,300 median annual wage, May 2023 | $28,390 at the 10th percentile | $135,420 at the 90th percentile |
| Illustrators | $59,345 median pay, 2025 | Data not available | Data not available |
| Special effects artists and animators | $62,400 median pay for special effects artists, 2025 | Data not available | $81,120 for special effects animators, 2025 |
| Musicians and performers | Data not available as a single median | $12,300 part-time earnings at the 2021 floor for musicians | Data not available |
| Sound engineering technicians | $84,456 median pay, 2025 | Data not available | Data not available |
| Producers / producer-directors | $71,427 median pay, 2025 | Data not available | Data not available |
Fine artists and illustrators
Fine artists and illustrators sit close together in the wage data, which is one reason broad salary guides often blur them into one category. The fine artist benchmark shows a median annual wage of $59,300, and the illustrator figure sits at $59,345, almost the same level. That similarity does not mean the jobs are interchangeable. It shows that portfolio-based visual work often competes in the same pricing band, even when the final output, client base, and sales channel differ.
For working artists, that has a practical implication. If your income depends on commissions, licensing, or one-off pieces, the label on your résumé matters less than whether buyers can clearly understand the kind of work you produce and how often they will need it.
Animators, motion artists, and concept-adjacent roles
Animation-linked roles usually support a stronger pay floor than gallery-facing art because they sit inside commercial production budgets. The available figures show $62,400 for special effects artists and $81,120 for special effects animators, which is a meaningful gap within the same broad creative family. That spread points to a market that rewards technical coordination, repeatable delivery, and work that can be inserted into larger production pipelines.
Concept-adjacent roles often follow the same pattern. They are more likely to be paid through salaried or contract work than through direct art sales, which makes compensation more predictable and usually ties earnings to project volume, deadlines, and production scale rather than to individual buyers.
Musicians and audio engineering
Music pay follows a different structure from visual art pay. The NEA shows part-time musicians at $12,300 at the low end of the earnings range, while sound engineering technicians are listed at $84,456 in the broader arts and creative labor market. That contrast shows how much the business model changes the paycheck. Live performance income, session work, and studio engineering are paid through different channels, and the technical role is usually attached to steadier commercial demand.
Producers and producer-directors also sit above the typical fine artist benchmark, with a median pay figure of $71,427. That does not make the role “better” in an artistic sense, but it does show how coordination, scheduling, and project responsibility can move pay upward when creative work is embedded in a larger production process.
The pattern is consistent across specialties. The more a role is tied to commercial delivery, technical execution, or repeatable production workflows, the more likely it is to sit above the center of the artist pay distribution.
Factors That Move Artist Pay Up or Down
The biggest mistake in artist compensation is assuming skill alone sets pay. In reality, the wage band shifts when the work sits inside a different hiring system, pricing model, or client market. That's why two artists with similar talent can end up on opposite sides of the distribution.
Experience changes the rate card fast
The BLS fine artist table shows the middle band stretching from $38,160 at the 25th percentile to $88,690 at the 75th percentile. That is a wide jump, and it usually reflects more than just years on the clock. Artists who can show dependable delivery, repeatable style, and lower revision risk tend to move into the upper-middle part of the distribution faster than artists who still sell only one-off pieces.
Medium and client type shape the ceiling
Digital work often earns differently from traditional work because buyers can scale it into campaigns, interfaces, trailers, or product launches. A print-only illustrator may sell a single asset, while a motion artist can license, adapt, and reuse the same core creative across formats. Commercial clients also tend to pay differently from galleries, nonprofits, or individual collectors because they buy business outcomes, not just finished art.
A client is rarely paying for the drawing alone. They're paying for speed, reliability, and the right to use the work in a revenue-generating context.
Freelance versus employment changes who carries the risk
Freelancers often have more pricing power, but they also absorb software, taxes, downtime, and unreimbursed admin work. Full-time employees usually trade some upside for steadier cash flow, benefits, and simpler budgeting. That trade-off is why the same creative skill can support very different annual outcomes depending on whether the artist sells hours, projects, or employment time.
Geography and business acumen still matter
Location matters because buyers, budgets, and competition are not evenly distributed. A regional market with fewer buyers can still support solid earnings if the artist owns a niche, but large media hubs tend to concentrate more commercial work and more price competition at the same time. Business acumen then becomes the final lever, because the artist who manages scope, communicates clearly, and negotiates confidently usually keeps more of the value created.
Where the Numbers Come From and How to Use Them
Salary data for artists is only useful when you know what it measures. The BLS Occupational Employment and Wage Statistics series is an official wage series, not a self-reported estimate, so it is the cleanest baseline for comparing occupations. The NEA's artists reports add another layer, because they focus on full-time employed artists and show how occupation choice changes earnings patterns over time. BLS fine artist wage series and NEA artists report
Read the right number for the right job
A median wage, a percentile floor, and a specialty-specific average answer different questions. If you want a stable employee benchmark, the NEA's full-time artist figure is useful. If you want to know whether a niche is compressed or highly unequal, the BLS percentile table gives more detail than a single average ever could.
Cross-check aggregators before you trust them
Salary aggregators can help with a rough market scan, but they often mix job titles, geographies, and time periods. The verified data shows why caution matters. One public source places U.S. artist pay at $23.76 per hour, while annual figures elsewhere can point to very different outcomes. For planning, treat aggregators as directional and the BLS or NEA as the anchor.
Turn a national figure into a local target
A national median only becomes useful after you translate it into your market. Start with the relevant BLS or NEA figure, then ask three questions, what city are you in, what type of client buys your work, and are you freelancing or employed. If your market has higher housing, transportation, and insurance costs, your target rate has to rise with them, or your take-home pay will fall short of the benchmark you started with.
For freelancers, the gross rate also has to cover the invisible parts of the job, including unpaid admin, software, self-employment taxes, and periods between paid assignments. A project quote should be built from expected billable time, not from the number of hours you personally spend creating the work.
Practical rule: never reverse-engineer a freelance rate from creative time alone. Price the business time too.
Why Some Artist Roles Pay Far More Than Others
Artist pay is uneven because artist labor markets are uneven. The NEA's 2024 data shows full-time employed artist earnings ranging from $45,590 for entertainers to $101,420 for architects, a spread of more than 2.2× inside the broader arts workforce. That gap is not mainly about talent. It reflects how the work is packaged, priced, and purchased. NEA 2024 earnings report
The billing model sets the ceiling
Architects and designers usually work in commercial systems with clearer scopes, repeatable deliverables, and clients who expect professional billing. Entertainers and other performance-heavy roles often face more variable demand, less standardized pricing, and more dependence on event calendars or cultural funding. Once the billing model changes, the income ceiling changes with it.
Designers gained ground for a reason
Among artist occupations, designers were the only group whose full-time earnings grew measurably between 2015 and 2024, according to the NEA. That pattern fits the market logic. Design work plugs directly into corporate needs, product launches, ad campaigns, and digital interfaces, so demand is steadier than many other creative categories. NEA 2024 earnings report
Performers and fine artists face a rougher path
Performers and fine artists often rely on grants, residencies, commissions, bookings, or direct sales. Those revenue streams can be meaningful, but they are less standardized and more uneven than salaried design work. The result is a wider income distribution, more volatility, and a stronger need to manage multiple revenue lines at once.
The core lesson is straightforward. Role selection matters as much as craft, sometimes more. An artist who chooses a market segment with repeat commercial demand usually has a better chance of climbing the pay ladder than an artist who stays in a low-volume segment and hopes talent alone will carry the day.
Strategies to Increase Your Earnings as an Artist
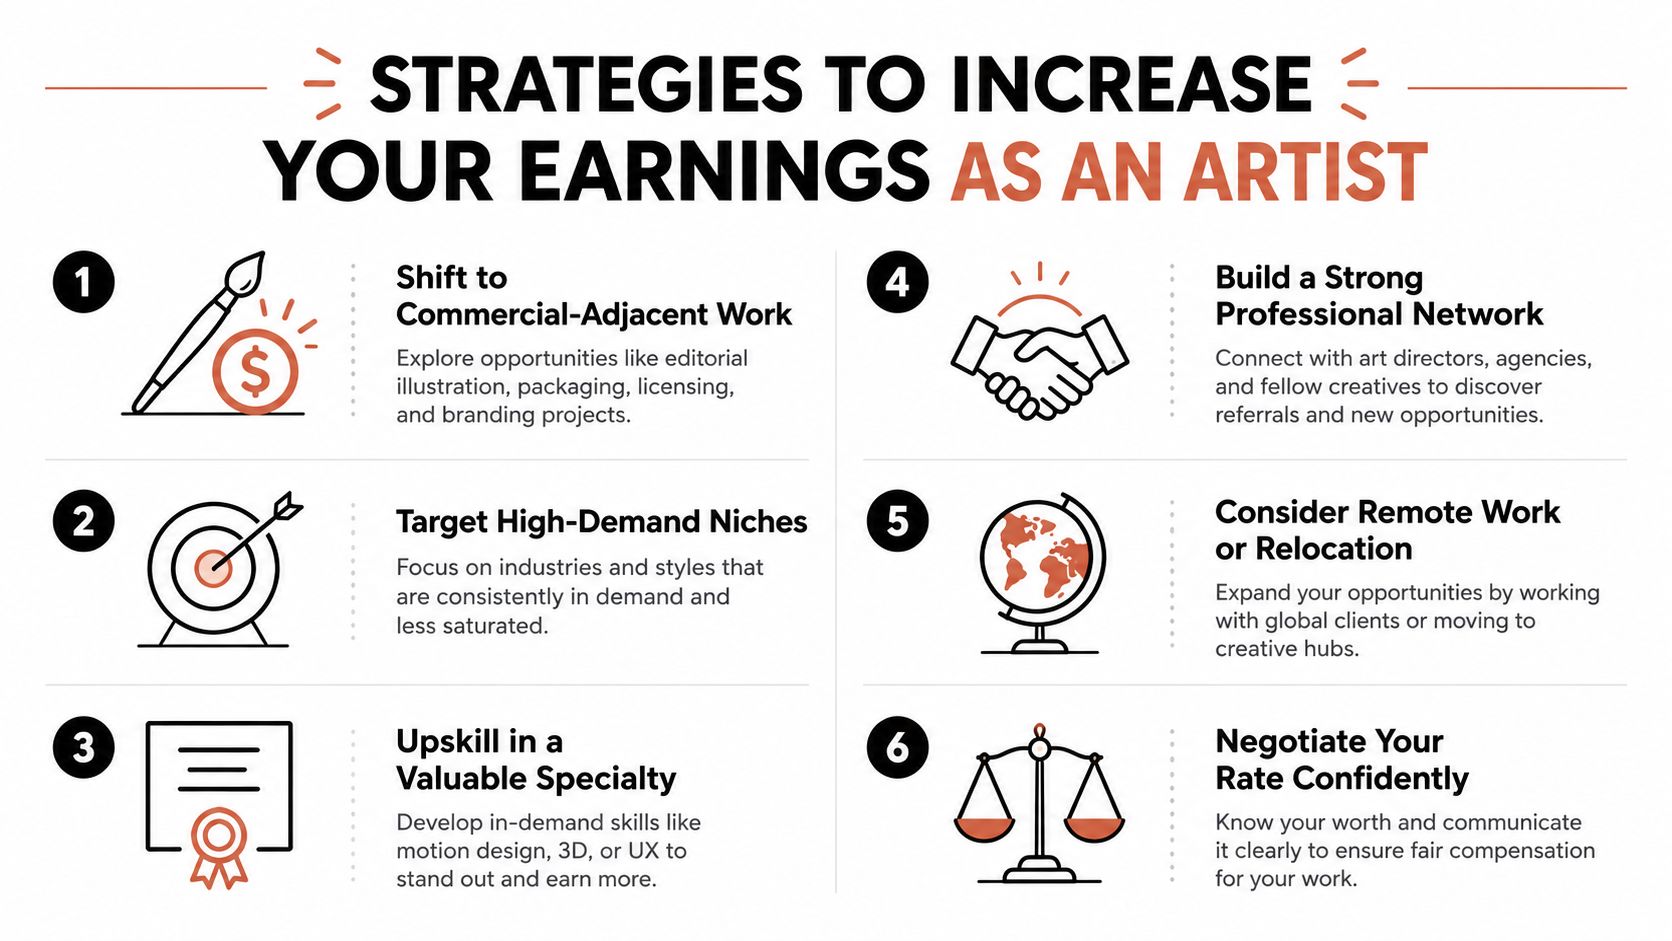
The highest earners usually don't rely on one revenue stream or one type of buyer. They shape their work toward markets that pay for repeatable value, not just originality. That shift can happen without changing the core of the art itself.
Move toward commercial-adjacent work
Concept art, design, motion graphics, and licensing tend to connect more directly to business budgets than pure one-off sales. If you already create strong visual work, shifting a portion of your portfolio toward commercial outcomes can raise your usable market without abandoning your style.
Price the use, not just the labor
A flat hourly rate leaves money on the table when the client gets ongoing value from the work. Project-based or value-based pricing gives you room to charge more when usage rights, turnaround speed, or brand impact are significant. A freelance animator who once quoted $4,000 for a video can often reframe the same job as a $7,500 deliverable when usage rights, revisions, and rollout scope are included.
Build a portfolio for the right buyer
Your portfolio should look like the work you want to be paid for. A gallery buyer wants different proof than a creative director or studio producer, and the portfolio needs to say that clearly. Keep only the samples that attract the client tier you want.
Negotiate with percentile anchors
If the BLS shows the 75th percentile for fine artists at $88,690, that becomes a defensible reference point in a negotiation, not an exaggeration. Anchoring to public data makes your ask feel grounded, especially when the client wants a discount without explaining why the scope should shrink.
Protect margin with better contract terms
Scope creep drains artists. Add revision limits, clarify usage rights, and use kill fees where appropriate so the project stays profitable even when the client changes direction. Those details are not administrative fluff, they're income protection.
Choosing Your Path and Setting a Realistic Target
The best income path depends on what kind of market you want to play in. A steady-employed route, such as in-house design or studio animation, usually gives the cleanest budgeting picture. A mixed freelance route can reach higher highs, but it also creates more variance from month to month. A prestige-creative route, like gallery-facing work or full-time performance, can be rewarding but tends to swing harder.
Pick one 12-month target using the percentile data, then work backward from there. If you want to move upward, the decision isn't only about talent, it's about client mix, pricing model, and how many paid hours you can realistically sell.
Common Questions About Artist Pay
How do I calculate a freelance hourly rate? Start with your target annual income, then add overhead for taxes, software, insurance, and unpaid time. The goal is not to match a salary figure on paper, it's to generate the income you keep.
Is freelance or full-time better financially? Full-time work usually wins on stability and benefits, while freelance work can offer a higher ceiling if you can keep your pipeline full and your contracts tight. The better choice depends on whether you value predictable cash flow or more control over pricing and client mix.
Where should I trust salary data? Use the BLS and NEA first, then treat aggregators as rough context. Those public sources are more useful because they define roles more clearly and separate medians from wider ranges.
How do I move toward the upper end of the range? Get closer to commercial demand, strengthen your portfolio for better clients, and negotiate from percentile data instead of guesswork. The artists who do that usually outpace the ones who wait for the market to reward them automatically.
If you're comparing creative career paths, ClearAudio can help you turn rough recordings into cleaner, more usable audio without adding extra production friction. That matters for artists, editors, and creators who need polished dialogue, music stems, or interview audio to support the work they're already selling.